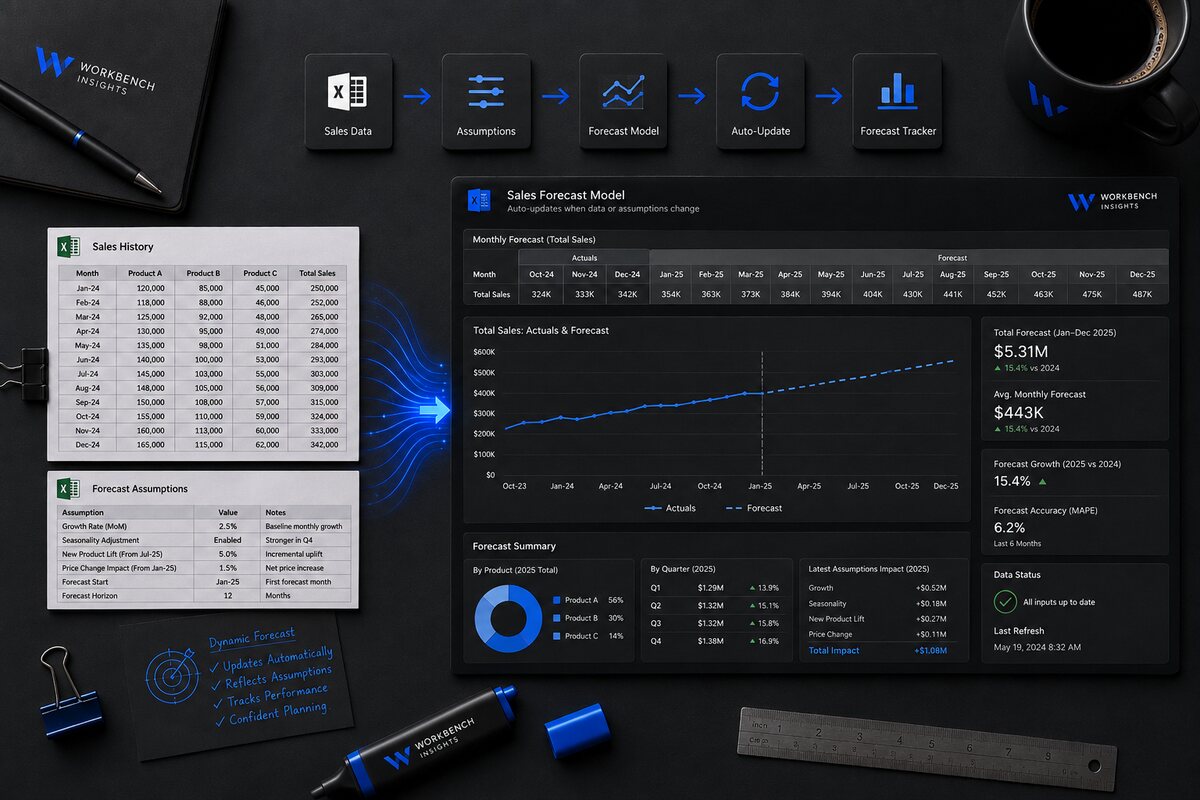
Most sales forecasts in Excel are really just last month's file with the numbers typed over the top. They take an afternoon, they break the moment the data shifts, and nobody quite trusts them. A forecast should do the opposite: pull in your actuals, project them forward on a rule you can defend, and let you test a scenario without rebuilding anything. Here is how to build that version.
Separate actuals, assumptions and output
The mistake that makes forecasts fragile is mixing the three. Keep an actuals tab that only your real data feeds into, an assumptions tab where every driver lives — growth rate, seasonality, targets — as labelled inputs, and an output tab that reads from both. You change the future by editing an assumption, never by overtyping a formula.
Let Power Query bring in the actuals
Point Power Query at your sales export once and let it do the cleaning — drop the junk rows, set the types, keep the columns you need. From then on the actuals refresh with one click, so your forecast always sits on current data instead of a copy that went stale the day you built it.
- Connect to the export, or the folder it lands in.
- Clean inside Power Query, not by hand on the sheet.
- Load a tidy actuals table the forecast can read.
Pick a projection you can explain
You rarely need anything exotic. A trailing average, a simple growth rate, or a linear trend (Excel's FORECAST.LINEAR or a TREND formula) will carry most business forecasts — as long as you can say out loud why you chose it. Layer seasonality on top only if your numbers genuinely move by month. A forecast you can explain beats a clever one you cannot.
Make scenarios a toggle, not a rebuild
Because your drivers live on the assumptions tab, "what if growth is 5% not 10%" becomes a single cell change that flows through the whole model. Set up best, likely and worst as three columns, or a small dropdown that swaps the driver set. That is the difference between a forecast you interrogate and one you just hope is right.
Show target, actual and projection together
Finally, put the three lines on one chart: where you targeted, where you actually are, and where the trend says you will land. The gap between the projection and the target is the number the meeting is actually about — so lead with it, and keep the rest as backup.
Want this built for your numbers? See the dashboards service or start a project.